About the Mitigation Wizard
The Mitigation Wizard is a web-based decision-support tool that helps users identify the potential impacts of their projects on special-status species and sensitive habitats, and then evaluate potential conservation or restoration project areas to offset them. The tool was developed to support Regional Advance Mitigation Planning (RAMP) by The Nature Conservancy, in collaboration with the Bay Area RAMP Technical Advisory Committee, to help infrastructure agencies, developers, natural resource agencies, and conservation practitioners in the Bay Area to do the following:
- Site development and infrastructure projects in a manner that minimizes impacts to sensitive species.
- Identify high-value conservation opportunities to mitigate these projects' impacts while contributing to regional conservation priorities.
- Provide decision-support for aggregating projects' impacts and aligning mitigation funding to invest in more robust conservation actions for improved project efficiency and conservation benefit benefit.
The Mitigation Wizard is freely accessible and integrated within the Bay Area Greenprint, which features extensive data and reporting depicting multiple values and benefits that nature and open space can provide to communities. This broader context can help users maximize the benefits of their projects for habitat, water resources, recreation, climate goals, and agriculture. Such benefits can help identify the potential for project partners across sectors.
How the Mitigation wizard Works
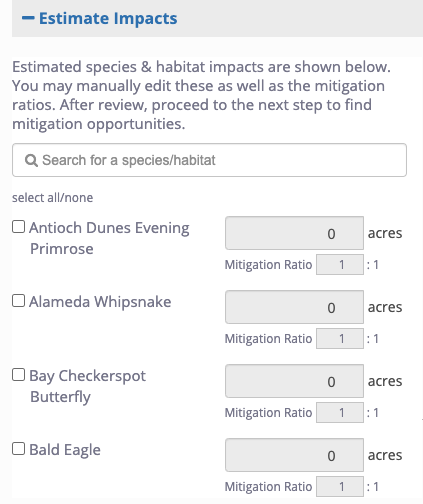
1. Identifying MItigation Need: known or estimated impacts to species and habitats
The Mitigation Wizard can identify impacts to a range of species and habitats from any project or suite of projects. Users can then edit the estimated acreages of impact and adjust mitigation ratios. Users who know the impacts to planned projects and mitigation need can enter their project impacts directly.
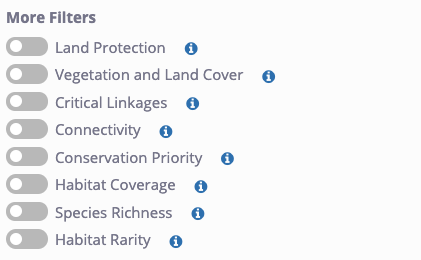
2. Find Mitigation Opportunities: filtering and selecting preferences
The Mitigation Wizard contains a series of filters that allows the user to search for opportunities for habitat protection or habitat creation/restoration, to identify the geography in which to search (e.g. specific watershed, county, distance from impact), to filter to just protected or unprotected land, the areas of highest conservation priority, highest species richness, areas within connectivity linkages, within a particular land cover, and/or more. Once filters are set, clicking Find Mitigation Opportunities will update the map. Over 100 other data layers hosted within the Bay Area Greenprint can also be viewed within Mitigation Wizard to further inform sites.
3. Iterate, adjust, share
The tool allows you to limit your search for mitigation with a range of filters. You can search only within a certain distance from your project, only within certain watersheds, counties or other preset areas, or within a shape you draw. You can even upload a shapefile or KML as a fully customized area to search for mitigation potential. The tool also provides methods to limit your search to only certain landcover types, only lands that are or are not protected, and a range of other variables. From there, you can save your settings and share the report with a link, an export (PDF, Excel, shapefile), or run the mitigation areas through the Bay Area Greenprint.
How we estimate impacts and suggest mitigation opportunities
The Mitigation Wizard can both estimate the impacts of a project based on one or more footprint areas, and it can suggest sites for mitigation based on mitigation need for a range of species or habitats available in our Species Models. These models are described in detail below.
For estimating impacts, we use the full resolution data for each species model tied to a 30-meter "fishnet" grid, each covering 900 square meters or 0.22 acres. We have divided the entire Bay Area up into 30 meter squares and assigned an acreage amount to each square for each species under each model. When you draw, select, or upload a project area, we intersect that area with the fishnet and return the sum of acres for each species, as shown here:
We take a planning unit approach for identifying potential mitigation areas. These functional units can be attributed with acreages of modeled species habitat and other attributes that can support filter options and additional criteria for conservation planning. With a set of 10 hectare (25 acre) hexagons, we attach total habitat acreage for species in each model, along with a range of other attributes. Many of those can be precalculated, such as land protection, land cover, habitat connectivity, and conservation priority (described below).
Other attributes of each hexagon are calculated dynamically as you use the tool. This is true of Habitat Coverage, Species Richness, and Habitat Rarity. Each of these is based on the suite of species you have selected for mitigation, so we can highlight those areas with the most or least habitat coverage, species richness, or habitat rarity for the specific species you have selected.
Species Models
The application relies on several species model approaches and we provide all as options to users to achieve the best outcomes from the tool.
We have models for two purposes:
- Protecting existing habitat
- Restoring or creating new habitat
And then within each purpose, we have models based on several different types of data:
- Suitable habitat in 2 mi of CNDDB occurrences (101 species). Modeled habitats nearer to verified observations of species (within 2 miles). With this more constrained geography, the impact analysis will be conservative (likely to identify less impact) and also less area for potential mitigation opportunities.
- Suitable habitat in 4 mi of CNDDB occurrences (103 species). Modeled habitat can be up to a distance of 4 miles from verified observations of species. Therefore, the geography is less constrained and the impact analysis will be less conservative (find more impacts. Using this model for identifying mitigation opportunities, will likely identify more opportunities for mitigation, but those sites may be more likely to indicate habitat where a species does not currently exist.
- Range defined by CWHR (14 species) Fewer species over larger range, so higher impacts per species.
The methodology below describes these options in more detail.
Habitat Preservation Models
For our habitat protection models, we compiled existing spatial data on the locations of threatened and endangered species, the distribution of land cover or habitats, and the locations of important agricultural lands. The amount of habitat likely to require compensatory mitigation was identified through the following methodology:
- California Natural Diversity Database (CNDDB) points were selected that corresponded with species typically requiring mitigation when impacted by infrastructure projects. From the CNDDB dataset, those that were listed as "presumed Extant" were selected.
- The points were buffered by two and four miles.
- The California Wildlife Habitat Relationships model (CWHR), developed by California Department of Fish and Wildlife, includes relatively coarse range maps for terrestrial, vertebrate species. For this subset of the species identified in CNDDB, we collected range map shapefiles.
- The two CNDDB-based shapefiles as well as the CWHR range map shapefiles were then overlaid on the land cover dataset.
-
Appropriate habitat types for each mitigation species were selected as follows:
- Vegetation types with a "High" rating in the California Wildlife Habitat Relationships model (CWHR) (California Department of Fish and Wildlife) for terrestrial vertebrate species were selected.
- Calflora listed land cover types for plant species were selected.
- Various online sources for invertebrate species were used to define appropriate habitat types.
- For plants, invertebrates, and unique types identified from the literature, the habitat requirements were cross-walked to CWHR types, so that their potential locations on the landscape could be identified using our reference maps.
- Species-specific habitat types were then selected from the buffer/land cover overlay for each species.
- Distribution data (NMFS) was used for salmonids.
Other non-species resources that require offsets if there are impacts are: riparian forest, wetlands, vernal pools, and oak woodlands. These were selected from the land cover dataset (described below).
Habitat Restoration Models
Restoration models for species used the same approach as the protection models described above. However, they included several land cover types in addition to existing habitat where restoration activity for a species might occur: agricultural areas, barren land, and Eucalyptus groves.
For restoration for ecosystems, the following methods were used:
- Oak woodland: existing oak woodland polygons (blue oak, coastal oak, and valley oak) were selected from the land cover dataset. These were buffered by 0.5 miles and oak woodlands as well as agricultural areas, barren land, and Eucalyptus groves were identified as potential restoration areas.
- Wetlands: existing wetland polygons (freshwater emergent and saline emergent) were selected from the land cover dataset. These were buffered by 0.25 miles and wetlands as well as agricultural areas, barren land, and Eucalyptus groves were identified as potential restoration areas.
- Riparian forest: we selected the ‘Stream Valleys' shapefile from the CLN 2.0 database. We then selected riparian forest (valley foothill and montane) agricultural areas, barren land, and Eucalyptus groves from the land cover dataset that intersected ‘Steam Valleys' and identified these as potential restoration areas.
- Vernal pools: grassland (annual and perennial) land cover was selected as was agricultural areas, barren land, and Eucalyptus groves. Those polygons within the USFWS statewide vernal pool dataset were considered potential vernal pool restoration areas.
- Serpentine: all areas within serpentine types identified in the SSURGO database were identified as potential restoration areas.
Conservation Plan Density
We developed a "heat map" of conservation priority areas as identified by a number of organizations or academic studies. Each hexagon was attributed according to its overlap with each of the priority areas. Those included were:
- CDFW ACE3 (Statewide Native Species Weight): mean value for hexagon area
- Bay Area Critical Linkages: % of hexagon intersecting with any of the BACL polygon types
- Central Coast connectivity (Thorne et al. 2006): % of hexagon intersecting with any of the polygon types
- California Rangeland Conservation Coalition priority areas: % of hexagon intersecting with any of the CRCC polygon types
- USFWS Critical Habitat (terrestrial): % of hexagon intersecting with Critical Habitat of one or more species
- USFWS Critical Habitat (aquatic): length of salmonid Critical Habitat in hexagon, normalized 0.0-1.0 by the maximum length found in a hexagon
- East Contra Costa County HCP: % of hexagon intersecting with ECCCHCP priority areas
- Central Valley connectivity (Huber et. al 2010): % of hexagon intersecting with identified linkage areas
- Audubon Society Important Bird Areas: % of hexagon intersecting with IBA
- Soil Agricultural Groundwater Banking Index (SAGBI): mean SAGBI value for hexagon area
- Santa Clara Valley Habitat Plan: % of hexagon intersecting with Burrowing Owl Fee Zones, Category 1 Stream Buffers, Serpentine Fee Zones, Valley Oak and Blue Oak Woodlands, or Wetland Fee Zones
- Santa Rosa Plain Conservation Strategy: % of hexagon intersecting with Conservation Areas, CA Tiger Salamander Corridors, or Windsor Plant Areas
- The Nature Conservancy Priority Areas: % of hexagon intersecting with priority areas
A total priority score was summed across these 13 priority types. Finally, the score was normalized 0-100 based on the number of potential conservation priorities that could be designated for each hexagon.
Landcover
Land cover data were compiled from several sources. The base layer used was the statewide "fveg" dataset produced by the California Fire Resource and Assessment Program (FRAP). This dataset is a raster grid of 30-meter raster cells classified into the major land cover types found in the California Wildlife Habitats Relationship (CWHR) model developed by the California Department of Fish and Wildlife. Where other finer-scale data were available, the fveg dataset was updated. These other datasets, in order of precedence (i.e. those higher on the list superseded those below) were:
- BAARI Baylands (San Francisco Estuary Institute)
- BAARI Wetlands (San Francisco Estuary Institute
- Santa Clara County land cover (developed for the RCIS by ICF)
- East Bay RCIS (developed for the RCIS by ICF)
- Napa County MCV (CDFW VEGCAMP)
- Delta (CDFW VEGCAMP)
- Suisun Marsh (CDFW VEGCAMP)
- National Wetlands Inventory (USGS)
These datasets were all crosswalked to CWHR land cover types.
Refinements to the Water and Wetlands Mapping
In 2022, we updated the Mitigation Wizard land cover to provide users greater flexibility in identifying mitigation needs and opportunities for water and wetlands. The update incorporated eelgrass beds (CDFW 2016), to supplement (and supersede) existing water and wetlands mapping in Fveg, BAARI Baylands, BAARI Wetlands, and NWI Wetlands, as outlined above.
Additionally, the tool was revised to offer users two levels of precision when differentiating water and wetlands:
- Simple: five categories, which primarily separate open water from wetlands, and freshwater from salt/brackish, with vernal pools split out as they require separate mitigation (i.e., from other freshwater wetlands); and
- Complex: nine categories, which provide greater resolution for the types of open water habitats and wetland communities.
The table below lists the categories in the two levels of water and wetland mapping in the Mitigation Wizard and provides a crosswalk relating the mapped features within the source data.
| Simple | Complex | Mapped Types (BAARI/NWI/CDFW Eelgrass) |
| Freshwater Wetland | Freshwater emergent wetland | Depressional Vegetated Natural |
| Depressional Vegetated Unnatural | ||
| Lacustrine Vegetated Natural | ||
| Lacustrine Vegetated Unnatural | ||
| Seep or Spring Natural | ||
| Seep or Spring Unnatural | ||
| Freshwater Forested or Shrub Wetland | Freshwater Forested/Shrub Wetland (from NWI only) | |
| Vernal Pools and other Seasonal Wetlands | Vernal Pools and other Seasonal Wetlands | Vernal Pool |
| Vernal Pool Complex | ||
| Playa Unvegetated Flat Natural | ||
| Lakes, Ponds, and Rivers | Lakes & Ponds | Depressional Open Water Natural |
| Depressional Open Water Unnatural | ||
| Lacustrine Open Water Natural | ||
| Lacustrine Open Water Unnatural | ||
| Rivers | Fluvial Channel | |
| Fluvial Ditch | ||
| Fluvial Engineered Channel | ||
| Fluvial Unvegetated Flat (in-channel) | ||
| Fluvial Vegetated (in-channel) | ||
| Saltwater and Brackishwater Wetland | Saltwater and Brackishwater Wetland | Playa Open Water Unnatural |
| Playa Unvegetated Flat Unnatural | ||
| Playa Vegetated Unnatural | ||
| Tidal Nascent Vegetation | ||
| Tidal Panne | ||
| Tidal Vegetation | ||
| Tidal & Subtidal Habitats | Mudflats | Lagoon Perennial Unvegetation Flat Natural |
| Lagoon Perennial Unvegetation Flat Unnatural | ||
| Lagoon Perennial Vegetation Natural | ||
| Lagoon Perennial Vegetation Unnatural | ||
| Tidal Bay Flat | ||
| Open Bay & Estuary | Deep Bay | |
| Lagoon Perennial Open Water Natural | ||
| Lagoon Perennial Open Water Unnatural | ||
| Shallow Bay | ||
| Tidal Ditch | ||
| Tidal Engineered Channel | ||
| Eelgrass | Eelgrass |