Nature is a fundamental part of the San Francisco Bay Area’s infrastructure. The wellbeing of our communities depends in ways big and small on the wellbeing of our local plants and wildlife, our forests and grasslands, our lakes and streams.

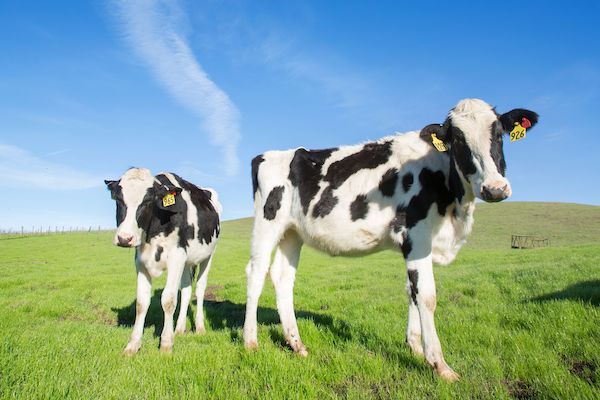
Food Production
Millions of people benefit from our region’s farms and rangelands. The local economy also depends on the $1.4 billion in food the Bay Area produces each year. The Greenprint measures land use, climate, soil type, and irrigation to support agriculture and ranching.

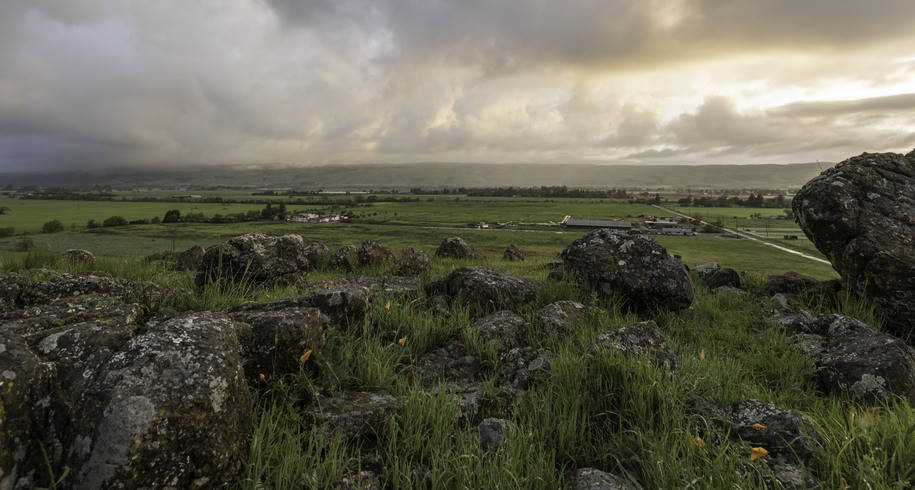
Water Supply
Some landscapes absorb, protect, and store water better than others. The Greenprint measures the contribution of the landscape to water supply through runoff and groundwater recharge, feeding municipal supplies, agriculture, and ecosystems.

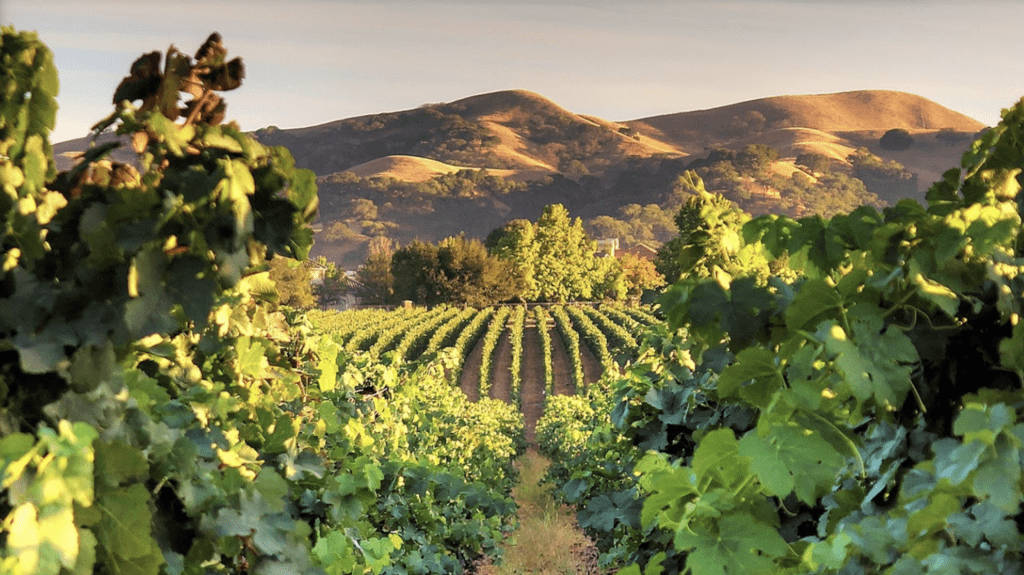
Water Quality
Clean water is essential for healthy communities. The Greenprint shows where natural habitat provides filtration benefits for surface runoff or where natural habitat buffers against contamination of groundwater aquifers.

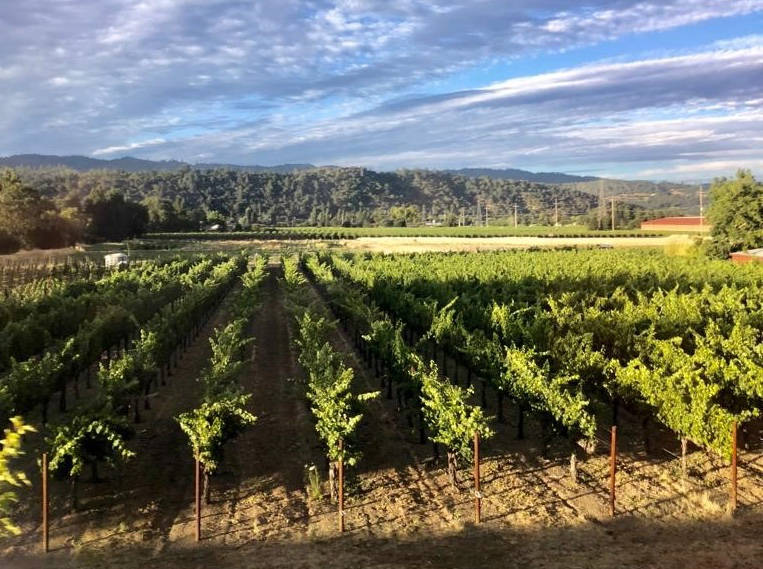
Water Hazard Risk Reduction
The Greenprint highlights natural lands that can serve as infrastructure to reduce the risks from flood water and storm surges to urban areas and agricultural lands by reducing flood velocity, depth, and longevity.

Prioritized Habitat
The Bay Area is a global biodiversity hotspot, with an extraordinary range of plants and animals, some of which are found nowhere else on Earth. The Greenprint draws on the Conservation Lands Network, riparian corridors, and baylands data to highlight critical biodiversity.

Habitat Connectivity
Connected habitats are more resilient, allowing free movement of plants and animals as conditions change. The Greenprint highlights Critical Linkages and regional connectivity data to highlight areas important to wildlife movement.

Compensatory Mitigation
Some sensitive species and habitats are protected by law, so any impact on them must be mitigated. The Greenprint reports hotspots of protected species and habitats to help identify areas, early in the planning process, where development could avoid costly mitigation.

Outdoor Recreation
Access to nature is key to everyone’s health and wellbeing, from children discovering the world to adults biking to work to seniors walking favorite trails. The Greenprint measures trail miles, accessible parklands, and other aspects of outdoor access.

Carbon Storage
Healthy habitats help fight climate change by capturing and storing carbon both in the trunks and stems of vegetation and belowground in the soil. The Greenprint helps you see where we can achieve climate change mitigation by avoiding the release of carbon into the atmosphere by converting the land to other uses.

Air Quality
Vegetation helps filter pollutants and clean our air, supporting the health of Bay Area communities. The Greenprint calculates the roll grasses, shrubs, and trees play in cleaning the air by removing particulate matter and nitrogen dioxide (N02), a key element of local air pollution.

Urban Greening
Our cities are vibrant centers of life for many Bay Area residents, and they are habitat too. The Greenprint shows how urban greening can support human health, water and wildlife resources by investing in nature in our built environments.

Climate Change
Climate change is woven throughout every aspect of our lives, and so the Greenprint weaves climate change through all our other themes and metrics, highlighting both threats to the important benefits nature provides and opportunities to improve their resilience.

Policy
In the Greenprint, resilience emerges when we are making the most of the many overlapping and complementary benefits of our landscapes, ecosystems, and human communities to ensure we can all thrive even as conditions change.

Resilience
In the Greenprint, resilience emerges when we are making the most of the many overlapping and complementary benefits of our landscapes, ecosystems, and human communities to ensure we can all thrive even as conditions change.
 Protected Lands
 Primary Land Cover
 Regional Connectivity
 Conservation Priority
 Critical Linkages